In this Neighbourhood Guide, you'll find out more about the people who live here as well as the schools, parks and recreation facilities, homes, and more.
An upscale neighbourhood with large homes, green spaces, and a consistent population.
Large, 2-storey, single-detached homes on large lots, some with mansions and attractive features.
A diverse community with residents from 84 different ethnic origins, creating a vibrant and inclusive atmosphere.
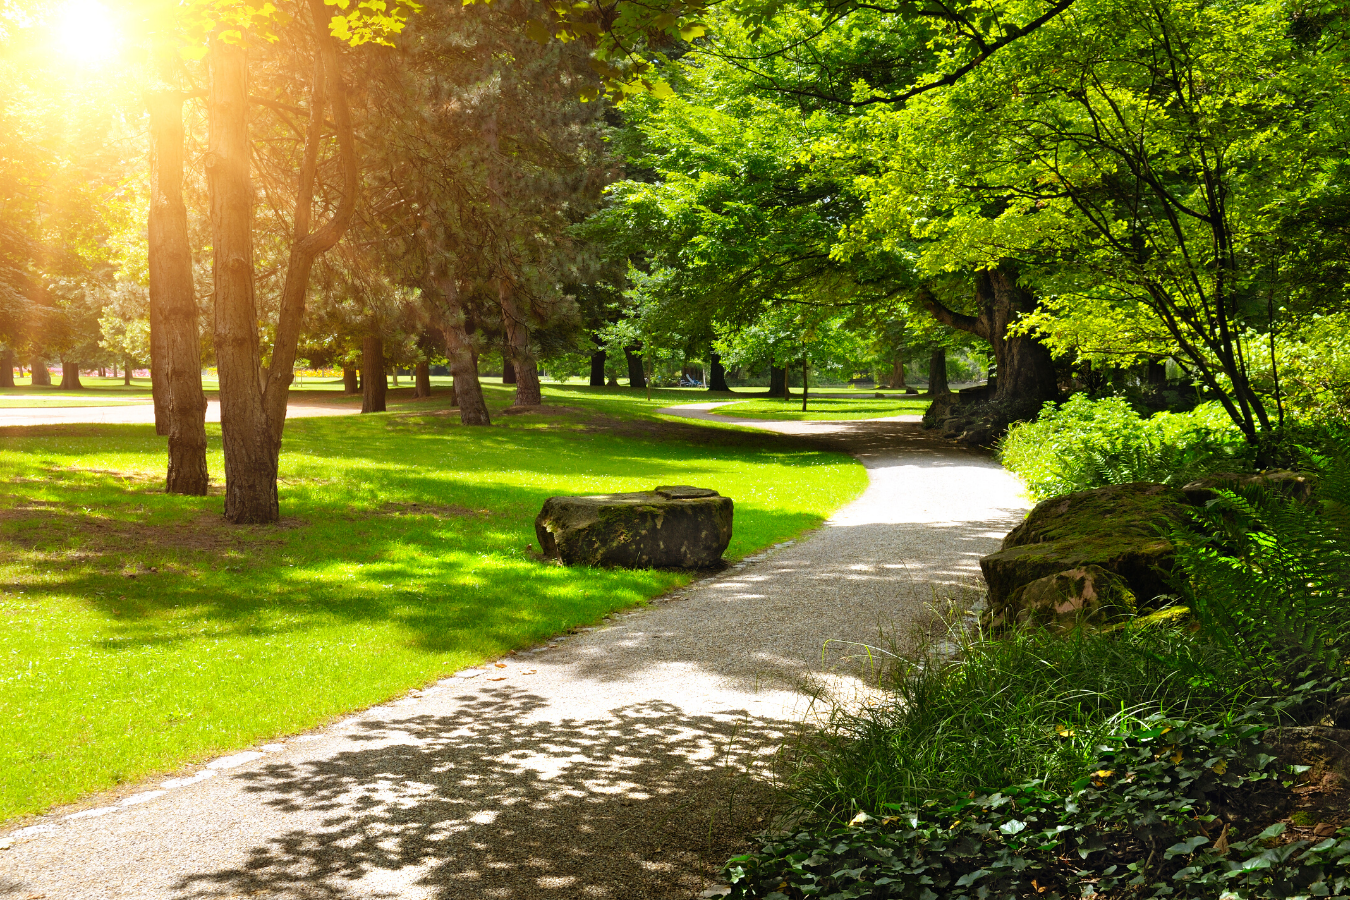
The abundance of parks and recreational facilities, perfect for families and outdoor enthusiasts.
Vales of Castlemore has a consistent population, and is popular with families with teens, people in their 20s, people in their 40s, and people in their 50s. The Vales of Castlemore residential neighbourhood is in northeast Brampton. Vales of Castlemore North is to its immediate north. The West Humber River flows through this neighbourhood, and there are large forested areas, ponds, trails, and green spaces. This is an upscale neighbourhood, featuring some mansions on large properties as well as large, 2-storey, single-detached homes on large lots, that were built into the 2000s.
People & Families in Vales of Castlemore
Families with kids make up 64% of households in Vales of Castlemore, while couples without children make up 10% of households and 3% of households are one person living alone. People in this neighbourhood come from 84 different ethnic origins, and 58% are first-generation immigrants, while 37% are second-generation immigrants.
Neighbourhood Households
3,350
Neighbourhood Population
14,823
Household Size
- 1 person - 3%
- 2 persons - 10%
- 3 persons - 14%
- 4 persons - 27%
- 5 or more persons - 43%
Household Types
- One-person households - 3%
- Non-family households - 0%
- Families with children - 64%
- Couples without children - 9%
- Multiple families in household - 22%
Children Per Family
- 1 child - 22%
- 2 children - 36%
- 3 or more children - 17%
Broad Age Ranges
- 0 to 14 years - 19%
- 15 to 64 years - 70%
- 65 years and over - 10%
Most Common Ethnic Origins
- East Indian - 57%
- Punjabi - 8%
- Jamaican - 6%
- Canadian - 5%
- Italian - 3%
Age of Primary Household Maintainer
- 15 to 24 years - 0%
- 25 to 34 years - 7%
- 35 to 44 years - 24%
- 45 to 54 years - 32%
- 55 to 64 years - 24%
- 65 to 74 years - 8%
- 75 to 84 years - 2%
- 85 years and over - 0%
Specific Age Groups
- 0 to 4 years - 5%
- 5 to 9 years - 6%
- 10 to 14 years - 7%
- 15 to 19 years - 8%
- 20 to 29 years - 14%
- 30 to 39 years - 12%
- 40 to 49 years - 14%
- 50 to 59 years - 13%
- 60 to 69 years - 8%
- over 70 years - 5%
Vales of Castlemore Schools
This neighbourhood has elementary special programs and secondary special programs. There are 11 public schools and 7 Catholic schools serving Vales of Castlemore. The special programs offered at local schools include International Baccalaureate and French Immersion.
Public Schools
11
Catholic Schools
7
Public
Having Fun in Vales of Castlemore
Fun is easy to find at the many parks & rec facilities here. Parks in Vales of Castlemore feature playgrounds for kids and sports parks. There are 8 parks in this neighbourhood, with 19 recreational facilities in total. The average number of facilities per park is 2.
Number of Parks
8
Number of Recreation Facilities
19
Recreation Facilities in Neighbourhood Parks
- Playgrounds - 8
- Basketball Courts - 4
- Sports Fields - 3
- Sports Courts - 3
- Trail - 1

As part of our mission to help you with home affordability, we are actively searching for special offers from Canada's best mortgage providers. Watch this space!
Getting Around in Vales of Castlemore
There are 92 transit stops in this neighbourhood. In this neighbourhood, there are mostly vehicle commuters, most commute to another city, and people have mostly medium commutes.
Commute Destination for Residents
- Commute within the city - 35%
- Commute to another city - 64%
Commute Types
- Vehicle - 87%
- Transit - 9%
- Walk/bike - 1%
Commute Times of Residents
- 15 to 29 minutes - 33%
- 30 to 44 minutes - 28%
- 45 to 59 minutes - 10%
- 60 minutes and over - 13%
- Less than 15 minutes - 12%
Work and Education in Vales of Castlemore
In this neighbourhood, 38% of adult residents hold a bachelor's degree or higher and 63% have any postsecondary education. The transportation and warehousing industry is the most common for residents.
Household Income
- Under $30,000 - 1%
- $30,000 to $39,999 - 2%
- $40,000 to $49,999 - 4%
- $50,000 to $59,999 - 5%
- $60,000 to $69,999 - 5%
- $70,000 to $79,999 - 6%
- $80,000 to $89,999 - 6%
- $90,000 to $99,999 - 6%
- $100,000 to $124,999 - 14%
- $125,000 to $149,999 - 13%
- $150,000 to $199,999 - 15%
- $200,000 and over - 12%
Most Common Occupations (Top 3)
- Sales and service occupations - 21%
- Trades, transport and equipment operators and related occupations - 19%
- Business, finance and administration occupations - 17%
Most Common Industries (Top 3)
- Transportation and warehousing - 16%
- Manufacturing - 15%
- Retail trade - 10%
Employment
- Employed - 62% of people over age 15 are employed
- Unemployed - 4% are unemployed
- Not in the labour force - 32% are retired, students, homemakers, etc.
Vales of Castlemore Homes
In this neighbourhood, there are mostly detached homes. Vales of Castlemore has a consistent population, with 36% of households having moved within the past 5 years and 11% having moved within the past year. It has mostly newer homes and is mostly owner-occupied.
Home Types
- Single-detached house - 80%
- Semi-detached house - 10%
- Duplex - 7%
- Row house - 0%
- Low-rise apartment/condo - 0%
- High-rise apartment/condo - 0%
Condominium Status
- Condominium - 2%
- Not condominium - 97%
Number of Bedrooms in Homes
- 1 bedroom - 1%
- 2 bedrooms - 3%
- 3 bedrooms - 11%
- No bedrooms - 0%
- 4 or more bedrooms - 83%
Period of Home Construction
- 1961 to 1980 - 0%
- 1981 to 1990 - 0%
- 1991 to 2000 - 10%
- 2001 to 2005 - 53%
- 2006 to 2010 - 22%
- 2011 to 2016 - 12%
- 1960 or before - 0%
Renters & Owners
- Owner - 92%
- Renter - 7%